Seven days, not two weeks
Sony Device Technology (Thailand) asked teams to build a dashboard that helps a factory deal with its production problems. Teams had two weeks. Our final exams landed in the middle of that, so the three of us really had seven days.
We planned the system with lecturers from our department first, then split the work and built it. Judging was 50% idea, 40% build (including source code and architecture) and 10% pitch.
What I built
I was one of three full-stack developers. My two teammates built the rest of the app.
- full stack
Operation page
- Live production simulator
- Socket.IO between page and server
- Progress ring from 0 to 100% per plan, plus a chart of material use per cycle
- Anomalies and material overuse
- backend
Production Plan APIs
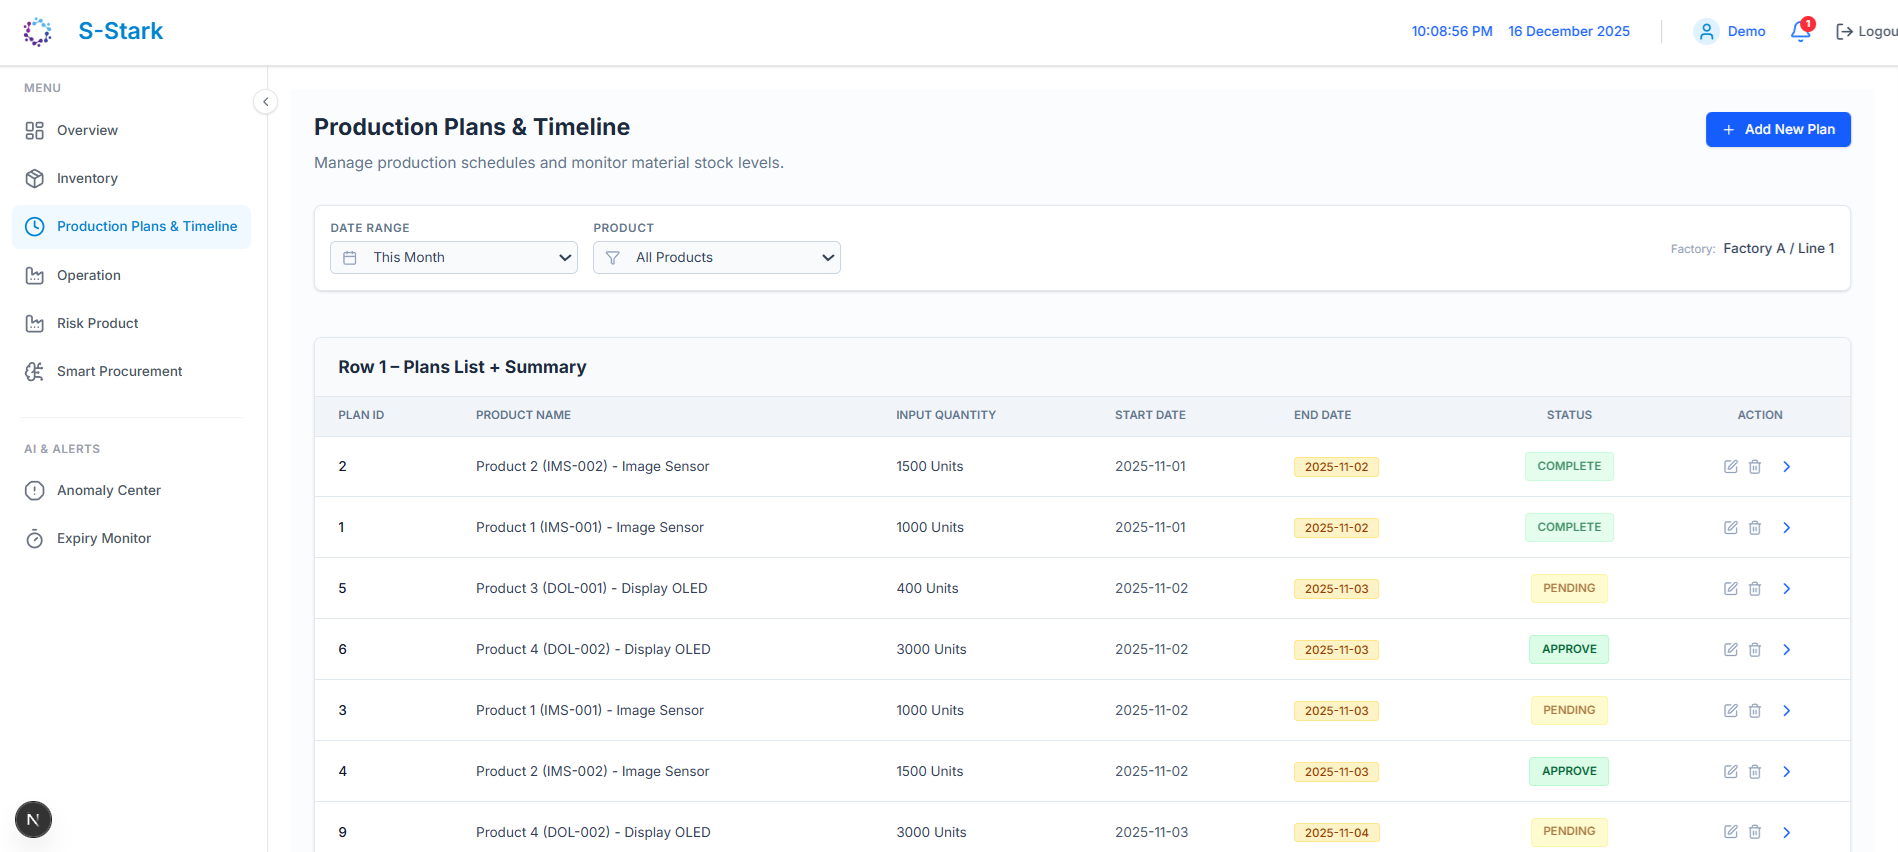
- Plans behind the Production Plans & Timeline page
- backend
Alert APIs
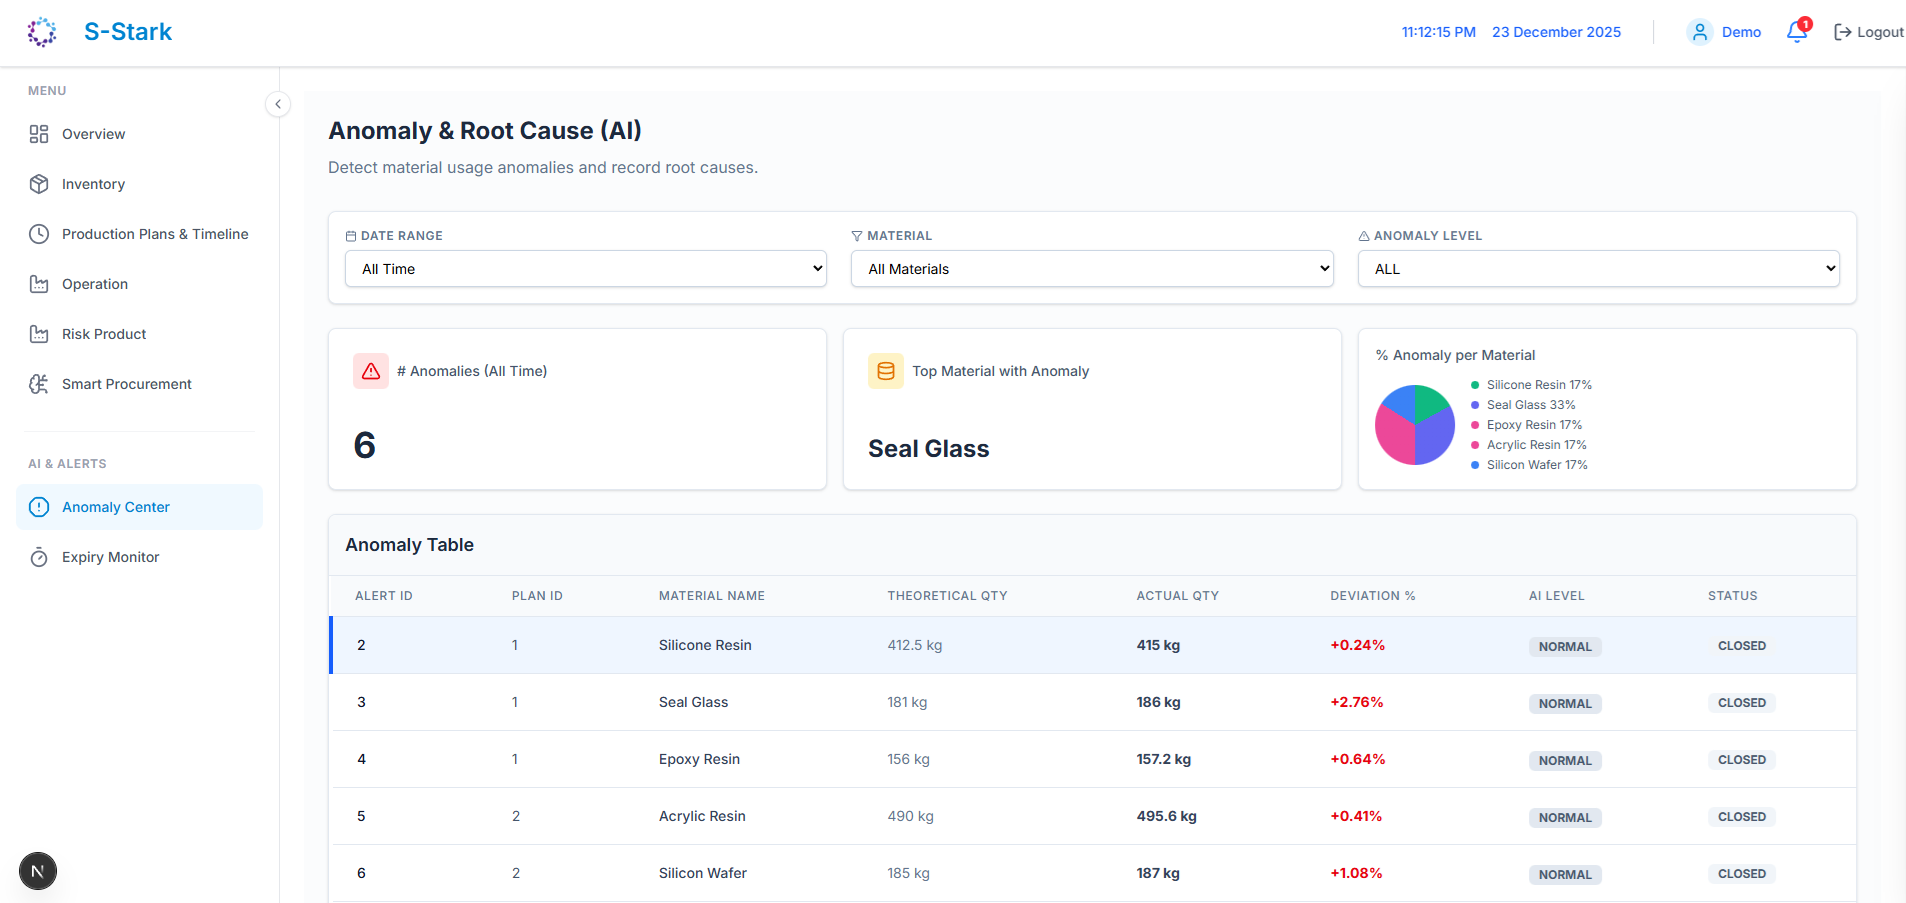
- Alerts behind the Anomaly Center
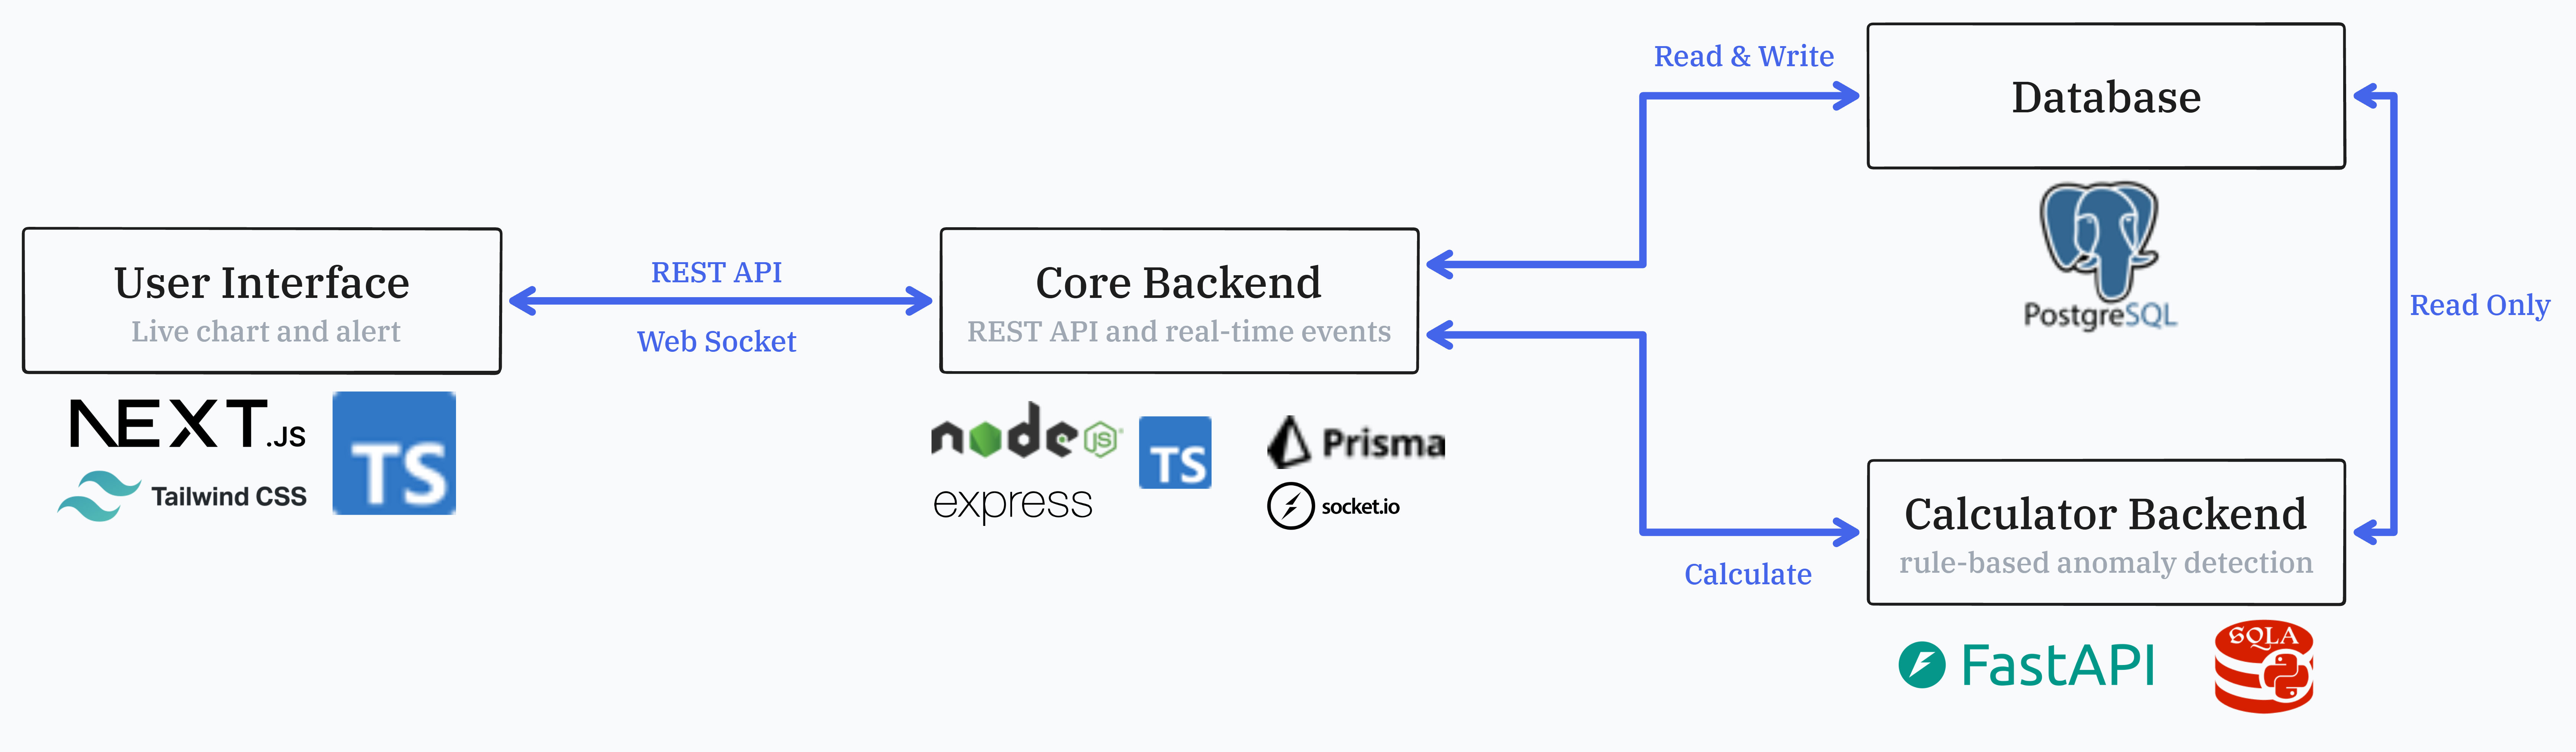
How it's put together
- User interface
- Next.js, TypeScript and Tailwind CSS. Talks to the core backend over REST and Socket.IO.
- Core backend
- Express with TypeScript and Prisma. Owns all the data and every write, and runs the production simulation.
- Calculator backend
- FastAPI with SQLAlchemy. Forecasts material use per plan, when each material runs out, and the last day to order more. It also checks manually logged usage against a 15% threshold.
- Database
- PostgreSQL. The calculator only reads from it: stock, bill of materials, production plans and material lead times.
Keeping the calculator read-only meant only one service ever writes data, so the two can't overwrite each other. Its answers are forecasts, recalculated every time, so there was nothing to store.
The live simulator
This was my part, and the one I cared about most. There were no real machines to connect to, so I built a simulator: every cycle it produces a random amount and randomly makes some materials run over, so the rest of the system has live data to react to.
In the last few days before the pitch I worked on it pretty much day and night. I was sure that a chart actually moving on screen, while other teams showed fixed numbers, would be the thing people remembered. Turns out I was right: no other team had a simulation at all.
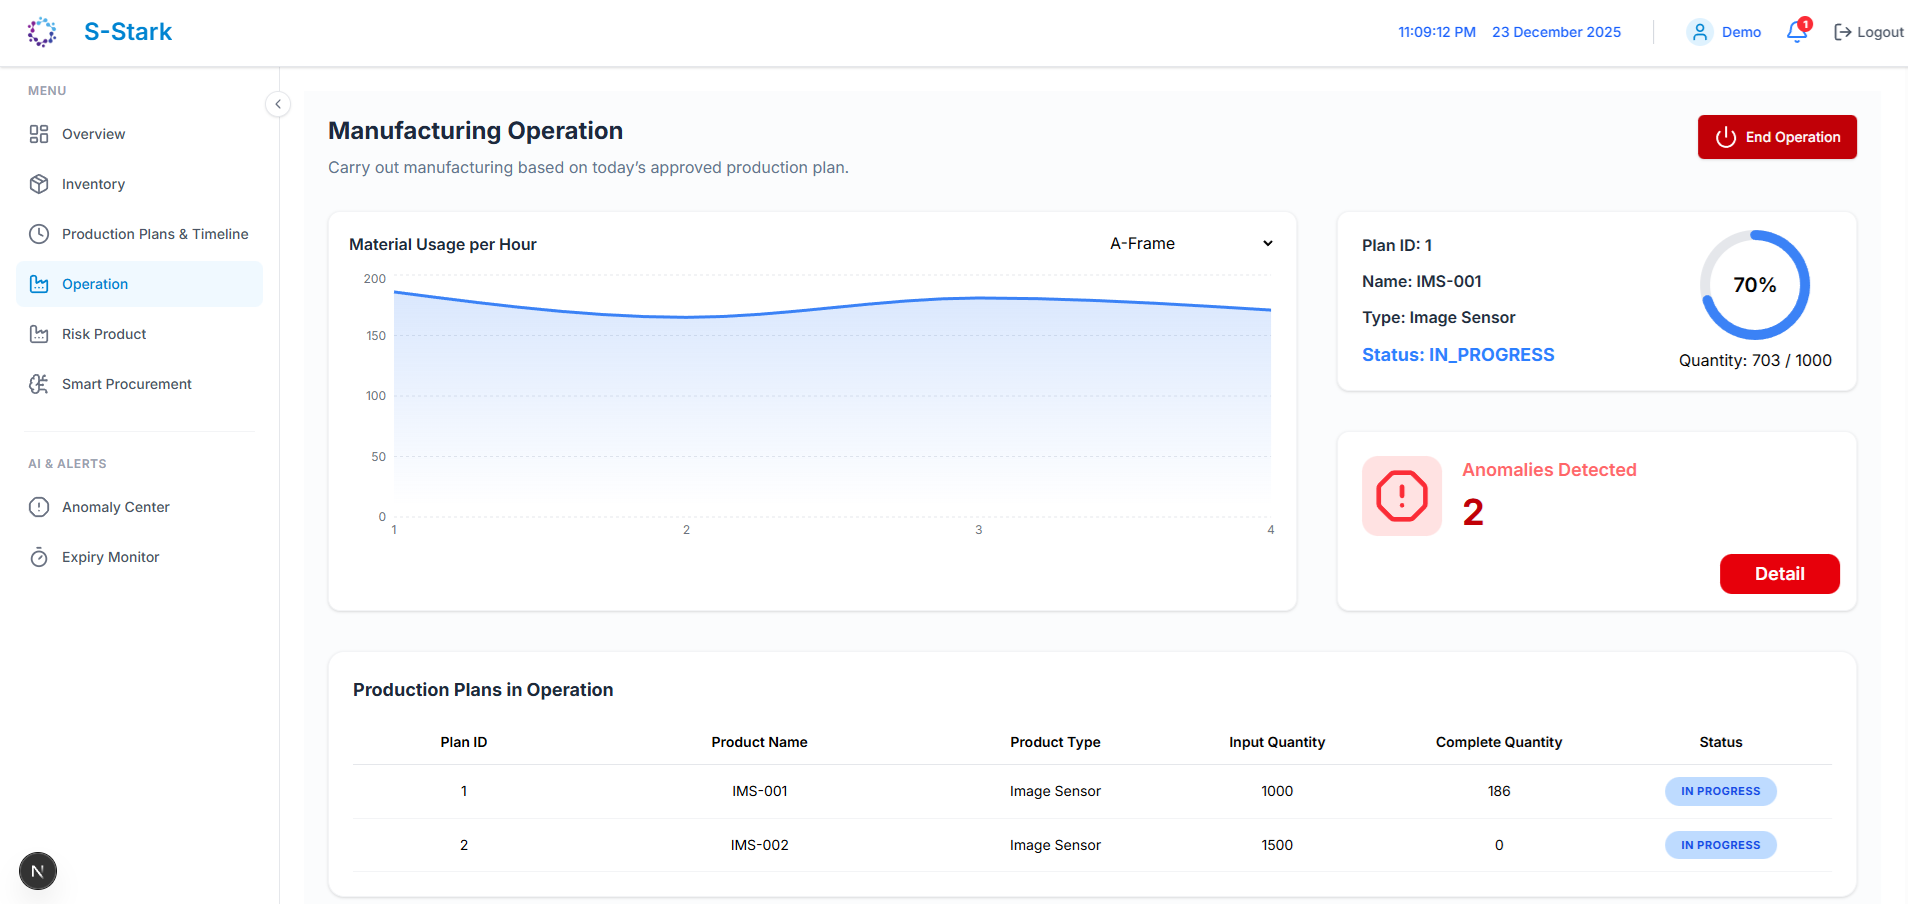
Press Start and the approved plans join the line. Every two seconds the page asks the server for an update, the server runs one production cycle, and the chart and progress move.
Each cycle counts as one hour on the chart. In every cycle:
- Output
- 150 to 200 units per cycle, never more than the plan asked for.
- Order
- One plan at a time, in the order they entered the line.
- Stock
- Deducted from the lot with the oldest manufacture date.
- Anomalies
- Each material has a 10% chance per cycle of using extra: the equivalent of 1 to 10 more pieces. The overuse is recorded and shows up in the Anomaly Center.
Plans and alerts
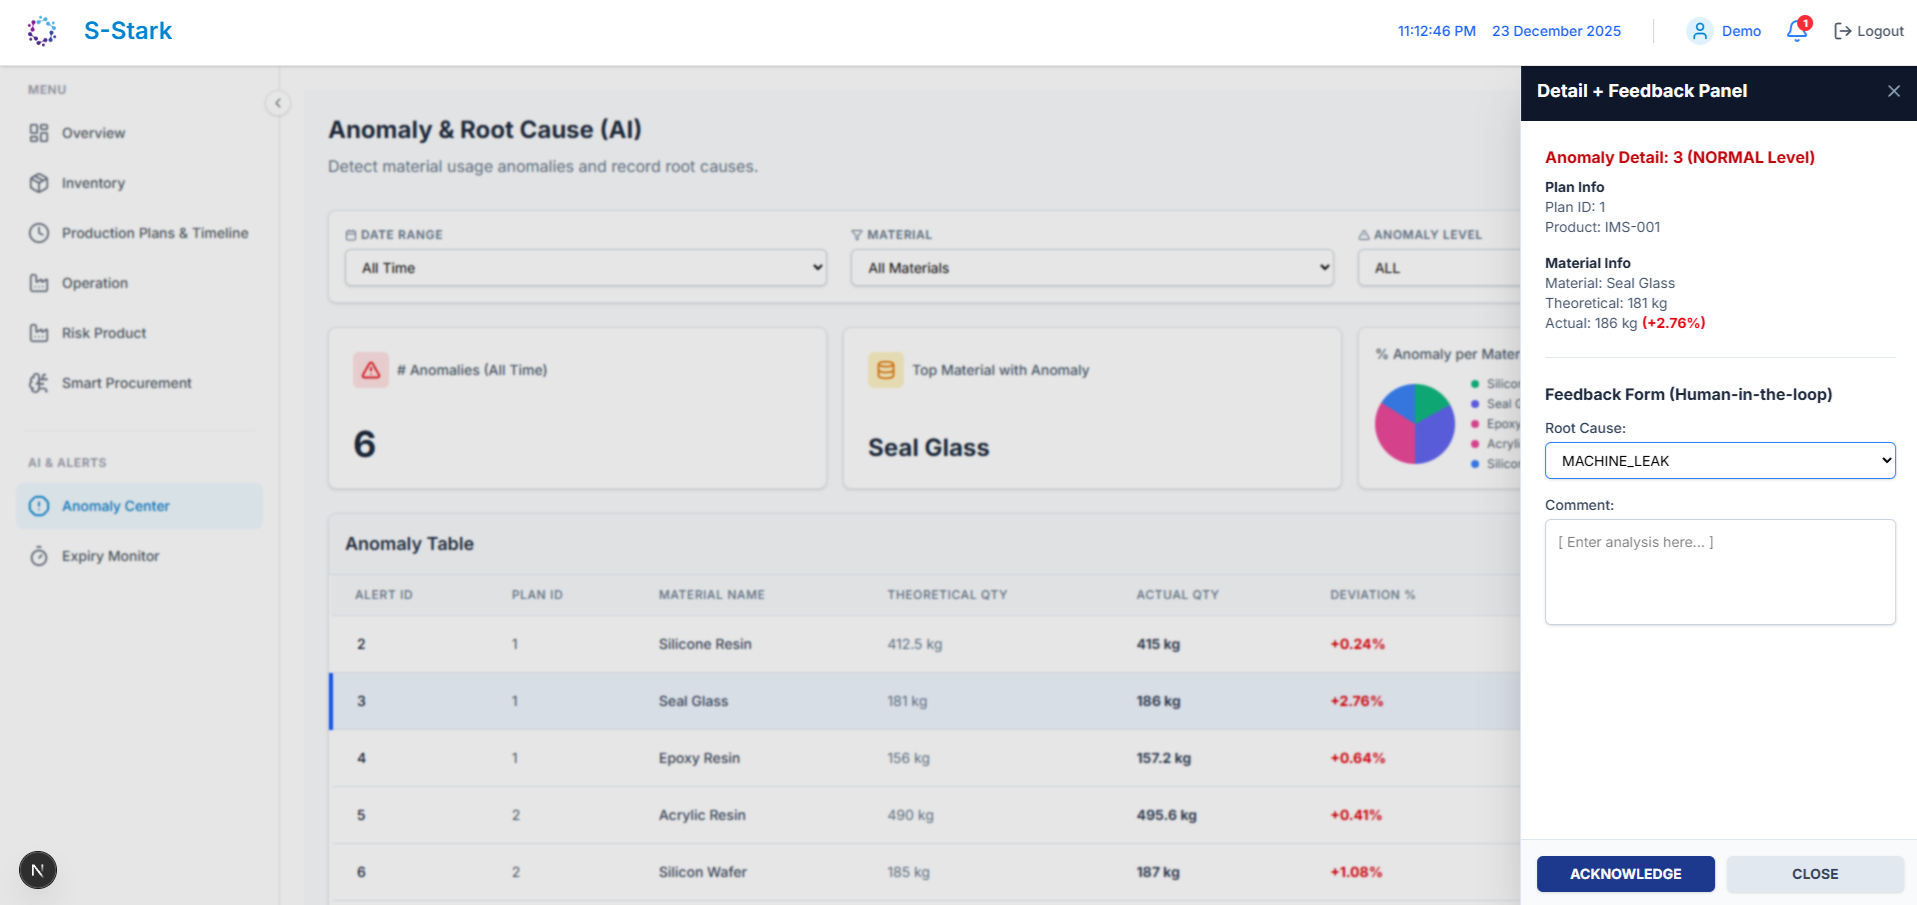
Behind the other screens are the APIs I wrote. The Production Plan APIs hold every plan and its status, from pending and approved to in progress and complete. The Alert APIs feed the Anomaly Center, where each anomaly shows the theoretical and actual usage side by side.
Choices and what they cost
Two backends instead of one
whyExpress handles data and business rules; Python handles the forecasting maths. Each stays small.
costTwo services to run, and the calculator's queries have to keep up with the Prisma schema.
The page drives the simulation
whySimple to build in seven days: the page asks, the server runs one cycle and answers.
costThe clock lives in the browser, so it behaves oddly with more than one tab open (more in lessons).
What I found when I reread the code
After the event I went back through my part. These are the things I'd fix first.
The clock should have been on the server.
The page sends a request every two seconds and the server runs one cycle per request, so it's really polling over a WebSocket. Open the page in two tabs and production runs twice as fast. The server should run the clock and push updates.
Overuse got saved as under-use.
Anomalies always mean extra material, but the record was labelled as under-consumption. A small label, but it's the kind of thing a report would trust.
Three rules for one word.
My deviation formula mixed units, and the anomaly flag was set to true in code. Calculated correctly, the overuse is about 0.5% to 6.7%, below the 15% threshold the calculator uses, and the Anomaly Center's 'AI Level' used yet another rule (10% and 20%). Three parts of the system disagreed. I'd have them all use the same rule.
It's rule-based, not AI.
The screens say AI, but the logic is fixed thresholds: 15% for anomalies, 10% and 20% for the AI Level, 3 and 7 days for ordering. That's still useful, and I'd name it a rule-based decision engine.
How it went
- Result
- 2nd place, 20,000 THB
- Time
- 7 days of real build time, team of 3
- Code
- Private at Sony's request
- Why I think we placed
- Two backends with clear jobs, and a simulation you could watch, when other teams had one backend and static numbers.